Blacktown North, Marayong Heights and Quakers Hill Public School Catchment Map Added

A smaller update than usual, just too much personal and work stuff happening right now. I do not know how long this sort of crazy times will keep going, but will try to at least keep up with regular updates. Three more public school catchment added for Western Sydney.

  • Blacktown North Public School
  • Marayong Heights Public School
  • Quakers Hill Public School

As usual contact the school in question or Department of Education for the final confirmation and you can also access the full NSW and Sydney Public School Catchment Map by following this link.

Share this post:

Array

Why some racial groups seem to do better than the others academically?

I have read the article What is the secret to Asian academic success? recently on SMH. What do you guys think, is this true? Article propose that some racial groups do better academically in America compare to the others. I only want to discuss this based on academicals performance not slide into the usual arguments people tend to slide into around this.

The racial groups make up between Australia and America is very different, yet there are a lot of similarities between two as well, particularly as a lot of minorities are recent immigrants. I think it is not a surprise for most to hear that a lot of Asians do well academically at all levels of schools in Australia. The question we need to ask is why that is case what drives them to excel academically. Also to clarify Asian in Australia generally referred as people from East and South East Asia majority of the time. Rest of part of Asian tend to be classified differently.

The article listed out a number of reasons why the author think that is the case, I will let you read those. Following is what I think what lead to Asian value Academical success highly.

  1. Asians in Australia almost always tend to be comparatively recent immigrants, as new immigrants they generally lack the social network that longer term residents enjoyed. Academicals success is the most easily measured and quantified compare to other areas. For many 1.5 and 2nd generation immigrants, the quickest path for upward social mobility is achieved through academic success.
  2. Education is valued highly in East Asia historically. Historically East Asian society is dominated by bureaucrats and the most common path to become one for common people is to pass the imperial examinations. This has create somewhat a culture that put a lot of emphasis with academic success and the pursuit of it.
  3. In my personal experience most of Asian parents in Australia whether due to their personal or cultural background pay great attention to their children’s education, this directly translate to academic success to a large degree. Certainly as in the article that very high percentage of the recent immigrants are highly educated and wish their children achieve the same success that they had.
  4. Competitive culture, I speculate due to the density and large size of population in East Asian, countries like Japan, Korea, China etc have been culturally very competitive. Tuition classes are in my view the most directly manifestation of this competitiveness.
  5. For better or worse many Asian parents wanted to see their children doing the best that they could with their abilities, whether that be academic or in other areas. I suspect this in large is due to the hardship many had endured in their own youth and do not wish their children having to do the same.

Asians do a lot of things that normal westerns may perceive to be extreme or borderline crazy in pursuit of better education/future for their children. One good example is purchase of properties that falls within the catchments of top ranked public schools, so their children could attend. Fortunately I suppose in Sydney that catchment for top public schools tend to fall into traditionally desirable suburbs to live as well.

With personal experience I think this large apply in the first to second generation, more generation the children has been in Australia less apparent this phenomenon is. Within a few generation this effect is much less so and most of Asian children performance in Academic aren’t that different compare to general population anymore.

Anyway enough of my ranting with things at work are crazy busy for me recently and hopefully will get more time to do updates soon.


Avalon, Bilgola Plateau and New Port Public School Catchment Map Added

Only three public school catchment map added, however this marks the completion of the Northern Beaches area for Sydney. There is really only Western and South Western Sydney left to do.

  • Avalon Public School
  • Bilgola Plateau Public School
  • New Port Public School

As usual contact the school in question or Department of Education for the final confirmation and you can also access the full NSW and Sydney Public School Catchment Map by following this link.

Share this post:

Array

Elanora Heights, Narrabeen Lakes, Narrabeen North, Mona Vale and Terry Hills Public School Catchment Map Added

Back from a short holiday over the long weekend, wish it was longer. However it was nice to be back in the saddle and get back to updating the map again. Getting close to closing out the North Beaches area. Five more public school catchment added as following

  • Elanora Heights Public School
  • Narrabeen Lakes Public School
  • Narrabeen North Public School
  • Mona Vale Public School
  • Terry Hills Public School

As usual contact the school in question or Department of Education for the final confirmation and you can also access the full NSW and Sydney Public School Catchment Map by following this link.

Share this post:

Array

Beacon Hill, Collaroy Plateau, Cromer, Dee Why and Wheeler Heights Public School Catchment Map Added

Five more public school catchment for the beautiful Sydney north shore area added. There is probably one or two more update worth of the work to do for North Shore, should be done soon and I’ll move back to Western Sydney most likely afterwards.

  • Beacon Hill Public School
  • Collaroy Plateau Public School
  • Cromer Public School
  • Dee Why Public School
  • Wheeler Heights Public School

As usual contact the school in question or Department of Education for the final confirmation and you can also access the full NSW and Sydney Public School Catchment Map by following this link.

Share this post:

Array

Belrose, French Forest, Kambora, Mimosa and Wakehurst Public School Catchment Maps Added

It is time to get back to Northern Beaches, five more catchment map for public schools added. I will most likely aim to finish the entire Northern Beaches before moving on to another area in Sydney.

  • Belrose Public School
  • French Forest Public School
  • Kambora Public School
  • Mimosa Public School
  • Wakehurst Public School

As usual contact the school in question or Department of Education for the final confirmation and you can also access the full NSW and Sydney Public School Catchment Map by following this link.

Share this post:

Array

Mini Update to Rosehill and Parramatta East Public School Catchment Map

It has come to my attention that the part of Parramatta north of the Parramatta river between the Macarthur Street and James Ruse Drive does not belong to Rosehill Public School and instead is part of Parramatta East Public School catchment.

No idea how I missed this one, I actually had a relative who lived in this area and her son use to go to the Parramatta East Public School, so I should have know this already. So shout out to “shuyuanli” for pointing out my error and much appreciated the help.

As usual contact the school in question or Department of Education for the final confirmation and you can also access the full NSW and Sydney Public School Catchment Map by following this link.

Share this post:

Array

How to rank public schools (Part 2)

First it is no surprise that schools with higher Socio-Educational advantage do significantly better than average. However even with schools that got similar ICSEA (Social-Educational Advantage Score), some schools do better than others.

First Wahroonga Public School, the 2014 NAPLAN result as following taken from Myschool website.

Wahroonga Public School Public School NAPLAN 2014

As you can see it does significantly better than the Australia average and about on par with similar schools.

Then you look at Epping West Public School, its 2014 NAPLAN result as following taken from Myschool website.

Epping West Public School NAPLAN 2014

As you can see Epping West Public School has significant higher score for all categories across the board even when compare to similar schools. Also I purposely picked these two school because none of them play host to OC classes which pollutes the result for year 5 and makes it impossible to do a straight comparison. This will artificially make some public schools rank higher than the others because they have a concentration of more talented students in the OC classes. List of public schools that will hosts the OC classes in 2016 can be find here.

Using the raw scores between school it is possible to compare schools directly with academically. It is difficult and very hard to measure other aspect of different schools. However ranking them will be hard as there are different categories through different years, how do you weight and compare the these?

When selecting schools, if test score if the main thing you value, then what Myschool website will provide everything you need as long as you understand how to interpret the data available. I will not go into too much detail on the topic of choosing a school for your child as they have been already covered in detail with the following articles

And finally if you ask me what is the different between these two school that with similar ICSEA score have such a difference, I think Epping West Public School just got more tiger mothers.

How to rank public schools. (Part 1)

One of the eternal question that get asked all the time is how does the school rank and how do they compare with each other. The primary source of the school information come from the relative newly minted myschool.gov.au that came out during the Julia Gillard’s labor government period. This site is absolutely monumental for someone like me, for the first time in ever I had access to just a wealth of information.

However now the question is how to interpret all these data and make sense out of them. We first need to understand ICSEA commonly being mentioned, official definition as following, in simple term higher the number more Socio-Educational Advantage a school has from the prospective of the Department of Education.

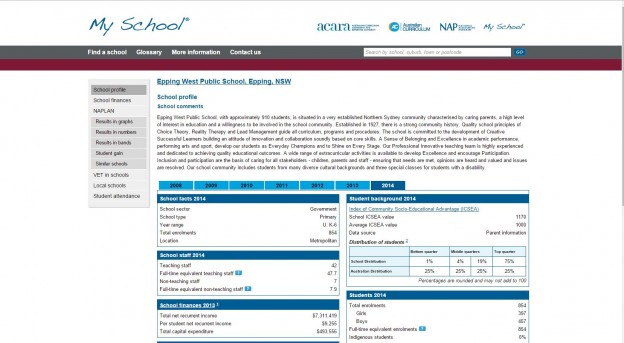
In using the Index of Community Socio-Educational Advantage (ICSEA) calculation to describe school populations on the website, the median value of all schools’ ICSEA values is set at 1000. This represents the ‘middle ground’ of educational advantage levels among Australian school students. The median is used because the ICSEA values of all schools are unevenly spread, reflecting the great diversity of student populations across Australia.

Most of stats on the site will compare with schools with similar ICSEA and another with all schools. One brief look at a single school such as Summer Hills Public School will show that it is only compared with 57 other school and ten of which is actually public school from NSW. Another thing with Summer Hills Public School is that it hosts OC classes for the local area as well, so the number for the year 5 are artificially inflated by this factor as well. What this means is that the raw result of year 5 of a school that host the OC classes can give a false impression of what general performance level.

There are five factor that NAPLAN measures

  • Reading
  • Persuasive Writing
  • Spelling
  • Grammar and Punctuation
  • Numeracy

It appears what myschool.edu.au gives a straight up measurement of number on above five which is possible to measure the schools against each other. However given the number of the schools in Sydney alone, let alone NSW and entire Australia, this is a mammoth task indeed.

There is no really a good way of mashing up the measurement from different year and also account for things like OC classes etc to extract a true general level of performance for a school. I will try to do a sample comparison on two schools to illustrate the difficulties in comparing the results.

Bankstown West, Condell Park, Milperra, Wattawa Heights and Yagoona Public School Catchment Maps Added

Tough set of update, took fair bit of research and healthy dose of guesstimate as well to come up with these maps. I am probably going to move back to Northern Beach suburbs soon to try finish that corner of the map first.

  • Bankstown West Public School
  • Condell Park Public School
  • Milperra Public School
  • Wattawa Heights Public School
  • Yagoona Public School

As usual contact the school in question or Department of Education for the final confirmation and you can also access the full NSW and Sydney Public School Catchment Map by following this link.

Share this post:

Array

en_AUEnglish (Australia)