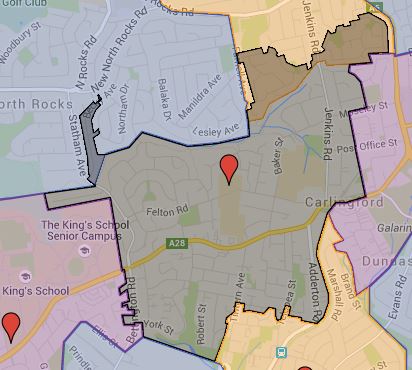
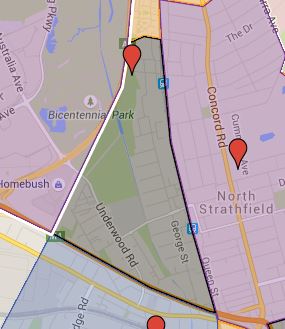
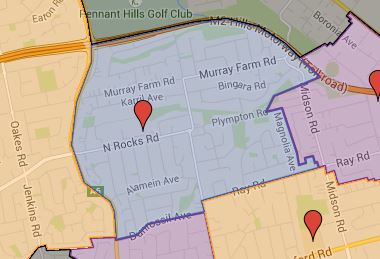
Blaxcell Street, Granville and Granville East Public School Catchment Map Added

Three more public school catchment map added, I actually missed the Blaxcell Street Public School previously and was wondering the over large coverage of South Granville of existing public schools. With Blaxcell Street Public School added, the coverage looks more sense.

  • Blaxcell Street Public School
  • Granville Public School
  • Granville East Public School

Parts of Granville Public School’s southern border is very much a guess, so as usual contact the school in question or Department of Education for the final confirmation and you can also access the full NSW and Sydney Public School Catchment Map by following this link.

Share this post:

Array

How to solve the problem that Motorola Android Phone and Tablet unable to Connect with the Computer as Camera or MTP device

This one is unrelated to my usual education topics, but I personally have spend hours if not days multiple times trying to resolve this issue with Motorola Android devices connecting to the computers as either, camera, MTP or ADP device. The problem started when I first acquired a Motorola Xoom tablet, one of the first usable Android tablet. No matter what I tried I could not connect to the Windows XP I was using at the time. I tried connect as ADP device, connect via debug mode, install Motorola USB drivers, plus just about everything that Google search can return, none worked. It is at end, finally some random forum mentioned that installing Media Center, so I installed that on Windows XP and everything just worked from that point.

I picked up a Motorola G 2nd Gen phone beginning of last year and it was a very solid phone for its price. I enjoyed the near vanilla experience and had no issue connecting to the Windows 7 that I was using at the time. Then after upgrading my computer and with the newly installed Windows 8, I had to go through this entire business again and problem is solved by installing Windows Media Feature which is no longer standard on Windows 8. Going on I have upgraded to Windows 10 at middle of the year which I loved so far, however I got the same problem back, so no issue since I know the solution already, just download and install the Windows Media Feature pack and problem solved.

Fast forward to November last year, suddenly that I could not connect the Motorola G 2nd Gen phone to the computer anymore. So I started going through the system and look like Windows update removed the Media Feature Pack, so I thought no issue, I will just do a Google search and install it again. So I clicked the first search result return in Google that in Microsoft installing Windows Media Feature Pack which download and install the Windows10-KB3010081-x64.msu.

To my surprise my trusty old fix no longer work again, so I went off on a tangent and wasted hours of my life going through the entire process again, trying and reinstalling various of drivers. Trying connect camera, MTP device and in debug mode etc, none worked. So I was pretty much back to the square one again. Without the abilities to connect the computer, my phone is close to being just a phone, so I persisted. Finally after more Google search I came across the solution, apparently the KB3010081 version of Window Media Feature Pack no longer compatible with my Windows 10 after the November update. So again after more Google searches, I found installing KB3099229_x64.msu and solved my connection issue.

So to summarise

First prepare by download and install the Motorola USB driver which is called Motorola Device Manager I believe in your system. Then carry out the following on your Windows version

  1. Widnows XP: Install Windows Media Center
  2. Widnows 7 and Vista: Windows Media Center is bundled and should just work
  3. Windows 8: Install Windows Media Feature Pack
  4. Windows 10: Should just work
  5. Windows 10N: You will have install Windows Media Feature Pack, please search and install KB3099229_x64.msu if you on November update or later.

I hope this save someone else some time, it literally wasted days of my life. Google searches does not return a straight forward answer for this issue and I only managed to solved the issue by piecing different things together.

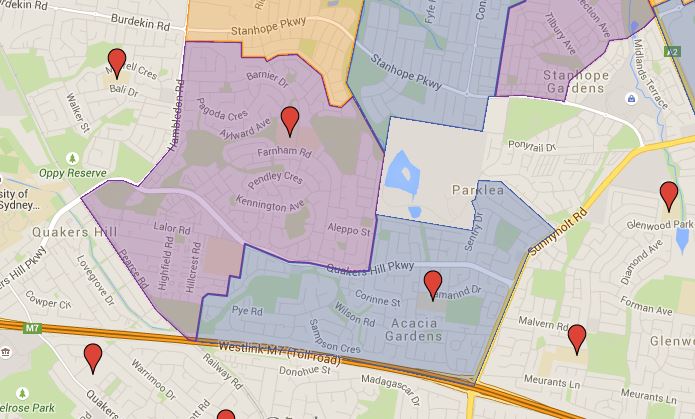
Guildford West, Merryland and Merryland East Public School Catchment Map Added

I hope everyone enjoyed their holiday and had as good time as I had. Time to get back on the saddle and crank out the updates I guess. Only a mini update this one will be including three school done.

  • Guildford West Public School
  • Merryland Public School
  • Merryland East Public School

The boundary for Merryland East Public School is very fuzzy and mostly estimated, so as usual contact the school in question or Department of Education for the final confirmation and you can also access the full NSW and Sydney Public School Catchment Map by following this link.

Share this post:

Array

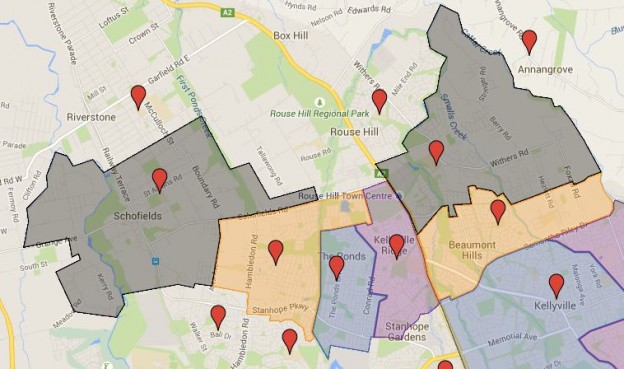
Greystanes, Sherwood Grange and Widemere Public School Catchment Map Added

Back to a mini update three more public schools updated for Western Sydney.

  • Greystanes Public School
  • Sherwood Grange Public School
  • Widemere Public School

As usual contact the school in question or Department of Education for the final confirmation and you can also access the full NSW and Sydney Public School Catchment Map by following this link.

Share this post:

Array

Enrolment Surge in Sydney North Shore Area

I have read the SMH article a few days back regarding the enrolment increase in NSW public School, you can find the actual article by following this link. I have particular interest in the North Shore area, so I thought I do a quick analysis of this area first. I have used the myschool to collect the data from 2008 to 2014. In there mere span of six years from 2008 to 2014, the enrolment number in the public school at primary level in the Sydney North Shore area went from 18417 to 22441, this represent an increase of 22%.

Detailed the school by school break down as following

20082014Percentage Growth
Artarmon Public School66798047%
Asquith Public School28233720%
Beaumont Road Public School5836084%
Beauty Point Public School24030025%
Cammeray Public School66487632%
Castle Cove Public School37549031%
Chatswood Public School68395740%
Gordon East Public School27235229%
Gordon West Public School42554829%
Greenwich Public School35548436%
Hornsby Heights Public School29738630%
Hornsby North Public School63382030%
Hornsby South Public School38951432%
Lane Cove Public School7898244%
Lane Cove West Public School32757676%
Lindfield Public School66072510%
Lindfield East Public School7177647%
Middle Harbour Public School3845635%
Mosman Public School59169618%
Mount Colah Public School38041910%
Mount Kuring-gai Public School168154-9%
Mowbray Public School26737842%
Neutral Bay Public School65489837%
Normanhurst Public School27031717%
Normanhurst West Public School36745023%
North Sydney Public School59875126%
Northbridge Public School46055521%
Pymble Public School53264822%
Roseville Public School6236200%
St Ives Public School3813933%
St Ives North Public School64277320%
St Ives Park Public School203167-18%
Turramurra Public School4705129%
Turramurra North Public School2983073%
Wahroonga Public School6817236%
Waitara Public School6096598%
Warrawee Public School38261762%
West Pymble Public School321306-5%
Willoughby Public School77899428%
Total Enrolment Number184172244122%

As you can see from the table there are some astonishing increase in number of enrolment for some school, in particular Lane Cove West and Warrawee Public School, each had seen 76% and 62% in total enrolment with just six years. There are twelve school in total had increase of more than thirty percent within the same time period. There are twenty three school in total recorded more than twenty percent growth in enrolment during this time period.

Twenty two percent overall growth is already very extreme, however some schools are experiencing very significant growth even higher than this rate. There really need to be some serious forward planning and capacity increase. From what I can see personally, this trend is unlikely to slow down anytime soon in Sydney at least in the North Shore area.

Many of the public schools in the area that I know off already crammed full of demountables or are in the process of building more to deal with the increase in enrolment. We really need to build and expand more classrooms. This shows how shore sighted the state government had been selling off all the state school sites not that long ago. Education is one of the most important investment we could make in a society and public education act as a safety net for the most disadvantaged which should have receive corresponding priorities.


A bit of fun work comparing Epping Heights, Epping West and Roselea Public School

Since I recently did the blog entry on changes to the Epping Heights, Epping West and Roselea Public School catchment for 2016, I thought it would be fun to do a quick comparison between these three public schools.

First let’s look at distribution of the students over each quarters with each other and Australian average for the year 2014. I feel this is a good representation of how well the students in a school is doing without having to delve deeper into the stats. I also felt indication how well a school is doing is not only at top, also at the bottom as well.

Bottom quaterLower middle quaterHigher middle quaterTop quater
Epping Heights Public School1%6%23%71%
Epping West Public School1%4%19%75%
Roselea Public School7%18%30%46%
Australian Distribution25%25%25%25%

Now let’s look like some miscellaneous stats about these three schools for the year 2014. ICSEA score for those that are not familiar with the term means “Index of Community Socio-Educational Advantage”. Attendance is also actually a good indication of school performance, in general better attendance of the school more likely it will perform better academically as well to the lower attendance counter part.

ICSEA ScoreLanguage background other than EnglishAttendance(2013)
Epping Heights Public School115857%96%
Epping West Public School118380%97%
Roselea Public School109854%97%

Some more fun stuff, enrolment number from 2008 to 2014 for these three school. As you can see enrolment number for Epping Heights Public School increased by 22%, Epping West Public School increased by 33% and Roselea Public School actually decreased by 26% over the same time period. With these number it is not a surprise that in the most recent catchment changes Roselea got a significant increase to its catchment at expense of Epping west and Epping Heights public school.

2008200920102011201220132014
Epping Heights Public School346333326339359371421
Epping West Public School640617628659688790854
Roselea Public School414396365360341320306

You can see the new 2016 catchment map for these three public school as following.

Epping Height, Epping West and Roselea Public School 2016 Catchment Map

As usual contact the school in question or Department of Education for the final confirmation and you can also access the full NSW and Sydney Public School Catchment Map by following this link.

Share this post:

Array


Epping Height, Epping West and Roselea Public School Catchment Map Updated

The school catchment for Epping Height, Epping West and Roselea Public School had been redrawn for 2016. This most likely due to the current enrolment pressure on Eppings West Public School, undoubtedly one of the most popular one in Sydney especially within the Chinese community. There are large number of new developments are being completed in the school catchment and preemptive actions like this will prevent the school become over crowded. Currently the redrawing of the boundary is primarily at expense of Epping West Public School whom lost significant part of the catchment to both Roselea and Epping West Public School. Epping Height Public School traded parts to Roselea and picked up similar amount from Epping West Public School, this should be neutral in terms of enrolment number wise.

This is the new 2015 boundary

Epping Height, Epping West and Roselea Public School Before Updated Catchment Map

This is the new 2016 boundary

Epping Height, Epping West and Roselea Public School Catchment Map Updated

Enrolment policy related to changes in catchment

  1. Changes Apply for the January 2016 intake
  2. Families with children already at these schools and who live in these newly re-zoned areas can continue to enrol further siblings at the same school
  3. A short transition period will operate where students can enrol in an existing school if there is clear evidence of a property purchase before December 2015
  4. Following January 2016, such enrolments will be considered “non-local” and will be managed in line with that school’s enrolment policy

As usual contact the school in question or Department of Education for the final confirmation and you can also access the full NSW and Sydney Public School Catchment Map by following this link.

Share this post:

Array


My journey through “Educational Opportunity in Australia 2015” (Summary and Conclusion) Part 6

Reading this study has been very interesting and also educational experience for me. Let’s first get some data down

About six in 10 or more of all children starting school get through early and middle childhood with the kinds of academic and social skills needed for later success. Similar numbers complete school and are fully engaged in education or work by their mid-20s. For this large group of young Australians, the education and training system works well and they succeed across all stages, making the most of the opportunities that the system provides. #1

Success at each stage varies by Indigenous status, language background, region and gender, and by the socio-economic status background of students. Only 68.3 percent of children born to parents in the bottom fifth of family socio-economic status are school-ready, compared with 84.8 percent of children in the top fifth. The disparity is similar in the middle years. Strikingly, only three in five from the bottom fifth (bottom two deciles of socio-economic status) complete a Year 12 certificate or equivalent by age 19, compared to more than four in five from the top fifth. Finally, socio-economic status affects the likelihood of economic success in the transition to adulthood, with 85 percent of those born into the top fifth being fully engaged in education, training or work at age 24, compared to just 65 percent of those in the bottom fifth.   #2

The effects of student disadvantage are quite strong in Australia compared to other countries, partly due to the extent of segregation and effects of differences in the concentrations of disadvantage on the performance of individual learners, and the education providers that they attend. #3

The climate and effectiveness of schools are also influenced by ‘push-down’ from systemic effects in postschool education and employment. Australian school leavers are caught in a difficult position, between an increasingly constrained labour market, which pushes young learners (especially women, who have lower uptake of apprenticeships) towards tertiary education, and competitive thresholds for university entrance. The squeeze at this critical transition point has severe consequences for learners who have not stayed on track throughout their schooling, and who are thereby disadvantaged in relation to their peers in accessing tertiary study and employment. While the system offers some ‘second chances’ that benefit many of these learners, data indicates that these are not accessed by some of the groups most in need. This means that the differences in educational opportunity that arise in the course of learners’ progress through the education and training system translate to inequalities in life outcomes at adulthood, reducing equity, productivity and social cohesion in Australian society. #4

Let’s do some conclusion of my own

  1. Socio-economic status is the biggest “predication” factor that on how well each student reaching the milestones and perform academically.
  2. Early childhood education matters.
  3. School matters, particular in NSW and VIC, less so in other states.
  4. Failing to reach earlier milestones can have cumulative affect later on.
  5. The high levels of segregation of students in Australia, due either residential segregation and the sector organisation of schools, tend to reinforce patterns of inequality and strengthen differences in school performance. This means that students from disadvantaged socio-economic status backgrounds tend to do worse because of the extent of segregation. #5

Let’s hope your guys enjoyed this as much as I did and will try to blog more regularly in the future.

My journey through “Educational Opportunity in Australia 2015” (Transition to Adulthood) Part 5

This one is going to be a little dry with mostly stats and data dominated. Transition to adulthood which in this particular study is milestone 4 that whether one is fully engaged in education, training or work. I have personally have finished my university study and started full time work during this age range of 20 to 24. It seemed so long ago when I was that young.

For many Australians aged 20–24 years, early adulthood marks a shift away from full-time education and training towards the labour market, and aspirations to develop careers and secure strong economic futures. Some will have built on academic success at school in continuing to higher education, while others build on skills acquired in training or the labour market. #1

Participation in education, training and work is often used as an indicator of the wellbeing of young people. Research suggests that young people who are not fully engaged in education or employment (or a combination of both) are at greater risk of unemployment, cycles of low pay, and employment insecurity in the longer term (Lamb & Mason, 2009; Pech et al., 2009). Participation in education and training, and engagement in employment, are considered important aspects of developing individual capability and building a socially inclusive society (Australian Social Inclusion Board, 2010).  #2

Now some stats on who made it and who missed the milestone.

In 2014, the majority (73.5 per cent) of young people aged 24 years (from a total of around 350,000) were fully engaged in either education or work. This rate varied depending on several background factors. #3

The gap between the highest and lowest deciles is 24 percentage points. Only 58.9 per cent of young people from the lowest socio-economic status decile of the population were engaged in full-time study or work; this percentage rises with each socio-economic status decile, reaching 83.1 per cent for those in the highest decile.   #4

The most significant risk factors of being unable to secure full-time work or engage in study or training and missing out are being Indigenous, being female, and coming from a low-socio-economic status background. While the overall number of 24-year-olds at risk in 2014 was over 90,000, women accounted for 55,470 (60 per cent), partly due to child-rearing and other unpaid domestic work. #5

Participation in higher education

The rates vary by social background. Only 17.3 per cent of young adults from the most disadvantaged backgrounds (lowest decile of socio-economic status) attended university, compared to 47.2 per cent from the most advantaged (highest decile). The opportunity for higher education study, and the professions to which it often leads, is far from evenly shared. #6

Differences in access to university study are partly linked to how well students do in school. Transition from Year 12 to university study is intrinsically linked to the level of senior secondary certificate achievement, due to the gatekeeper role that Year 12 assessment plays in entry to higher education. The link with school achievement pushes further back down the year levels to the middle years.The lowest achievers had very little chance of enrolling in higher education, with only 15.3 per cent enrolling by age 24. This relationship is linear as we ascend socio-economic status until, in a mirror-image reflection of the lowest achievers, 77.5 per cent of the highest achievers transition to university by age 24. #7

Roughly 22 per cent of university entrants dropped out or had not completed within eight years. #8

The ATAR scores of school leavers are a major predictor of non-completion. Almost all those entering university with ATAR scores above 95 complete (only 3.9 per cent drop out). The rate for those with average ATAR scores (70–79) is 21.6 per cent, while for those with ATAR scores between 50 and 59 the dropout rate is 37.6 per cent.   #9

Despite the much lower chances of gaining entry to university (and potentially selection of only the most able), low-socio-economic status students experience a higher rate of dropout than high-socio-economic status students. Over a quarter of low-socio-economic status students did not complete their course, compared to less than a fifth of high-socio-economic status students (26.3 per cent vs 18.9 per cent). These data illustrate the compounding negative effect that social disadvantage has on a young person’s ability to access and succeed in higher education, as well as indicate the different roles that higher education has in the lives and aspirations of young people from different social groups. #10

Participation in Vocational Education and Training (VET)

At a national level, it shows that in 2014 nearly one in five of all 20–24-year-olds were enrolled in VET (19.6 per cent, NCVER 2014). #11

It shows that one in two young people undertook some type of VET study in their teenage years or early 20s. While many enrolled, about 70 per cent had completed the study by their mid-20s. This meant that 35.6 per cent of all young people had completed a VET course by their mid-20s.  #12

Roughly one in two low achievers at age 15 (lowest quintile of mathematics achievement) had completed a VET qualification by their mid-20s. The rate for high achievers was about one in seven, largely because high achievers pursued forms of further study other than VET. #13

Participation in apprenticeships

In 2014, 5.9 per cent of 20– 24-year-old Australians were doing an apprenticeship or traineeship. These are more prevalent among men, who were nearly three times as likely to be indentured as women (8.7 percent vs 3 per cent). #14

Apprenticeships and traineeships are an important pathway for low achievers in school as well as for students from low-socio-economic status backgrounds. Over a third of young people in the lowest quintile of mathematics achievement at age 15 gained an apprenticeship, and almost a quarter had completed their trade training by their mid-20s. Similar estimates occur for young people from low-socio-economic status backgrounds. #15

Labour market participatio

Overall, in 2015, 41.3 per cent of 20–24-year-olds were employed full-time, 30.2 per cent were employed part-time, 7.4 per cent were not working and looking for work, while 21.1 per cent were not working and not looking for work. #16

Men were much more likely to be employed in full-time positions than women (47.2 per cent vs 35.2 per cent), yet were also more likely to be unemployed (8.8 per cent vs 5.9 per cent). #17

Only 2.6 per cent of 20–24-year-olds from high-socio-economic status (highest decile) origins were not in the labour force, versus 14.2 per cent of those from the lowest socio-economic status category. #18

We almost at end of this journey now and next blog entry will round this up with the conclusion and my own summary as well.

#1 to #18 Educational opportunity in Australia 2015

My journey through “Educational Opportunity in Australia 2015” (The Senior School Years) Part 4

I have a pounding headache for some reason and probably will be a little brief on this particular blog. Which one of you remembered the high school years? I personally had a good time and felt what has been learned was useful in laying the foundation for my future studies.

Those with Year 12 have a greater likelihood of continuing with further study, particularly in higher education, as well as entering the workforce. They also have better prospects of good health, employment and welfare, as well as improvements in the ability to participate socially and economically in their communities. At a broader level, Year 12 attainment contributes to the development of a skilled workforce, and in turn, to ongoing economic development and improved living conditions. #1

Now let’s get down to some stats and interesting data

Only 60.6 per cent of young people from the lowest socio-economic status backgrounds completed Year 12 or its equivalent. The rates of attainment increase with each rise in socio-economic status, reaching 89.1 per cent for those in the highest decile. #2

Young people  from families in which the main language spoken at home is not English – are more likely to complete school than those whose main language at home is English; the difference is about 11 percentage points (83.4 per cent vs 72 per cent). This finding is in line with research showing that even though the average educational attainment of parents in non-English-speaking families is often lower than their native English-speaking peers, they have higher educational aspirations for their children and place a premium on completing Year 12 as a way of enhancing their children’s future prospects (Miller & Volker, 1987). There are differences based on the type of language spoken at home. The highest rates of completion are among those children whose parents speak Eastern and Southeast Asian languages (such as Chinese or Vietnamese languages). #3

The main factor influencing achievement is social background. Seventy per cent of the variance in mathematics achievement is due to socio-economic status differences, and 74 per cent in science achievement. Socio-economic status also has a large independent influence on reading (accounting for 57 per cent of explained variance), though less than for mathematics and science, due to the effect of gender on reading achievement. #4

There of course question on what are the factors that causing difference in achievement and completion? We always know different school makes difference, but how much difference do they make? What are the other factors?

The main factor influencing achievement is social background. Seventy per cent of the variance in mathematics achievement is due to socio-economic status differences, and 74 per cent in science achievement. Socio-economic status also has a large independent influence on reading (accounting for 57 per cent of explained variance), though less than for mathematics and science, due to the effect of gender on reading achievement. #5

An analysis of the 2012 mathematical literacy results in PISA, shows that in Australia the amount of variation between schools (31 per cent) is lower than the OECD average (37 per cent). #6

The analysis also found that more than half of the performance differences observed across students in different schools can be accounted for by socio-economic status differences between students and between schools. #7

Segregation, residualisation and division of labour

Low-socio-economic status communities in Australia are largely served by government schools. Just on 77.5 per cent of students from the most socially disadvantaged backgrounds (lowest socio-economic status quintile) attend government schools (Panel 1). Conversely, only 37.5 per cent of the most advantaged students (top socio-economic status quintile) attend government schools. Just over 35 per cent attend independent schools and a further 27.2 per cent attend Catholic schools. #8

Nationally, government schools enrol 59.3 per cent of secondary school students, but they have the largest share of students with disabilities (76.4 per cent), Indigenous students (79.4 per cent), and the lowest mathematics achievers (76.2 per cent). There is therefore a very uneven division of labour across school sectors in terms of schooling-disadvantaged secondary school age Australians. There is also a segregation of the population based on these characteristics. #9

Additionally, there is the impact of family aspirations. Government schools form a market, in which schools that have not reached their enrolment limit allow families to make choices, bypassing some schools in favour of others. The movement of students from aspirational families to desirable schools in both the government and non-government sectors leaves schools in some communities with residues of concentrated poverty or students with higher needs, making it harder for these schools to achieve the same outcomes for students. #10

The high levels of segregation of students in Australia, due in large part to residential segregation and the sector organisation of schools, tend to reinforce patterns of inequality and strengthen differences in school performance. This means that students from disadvantaged socio-economic status backgrounds tend to do worse because of the extent of segregation. #11

I can personally attest to this segregation and residualisation affect in the government schools. I attended a none selection government secondary school on the edge of inner west Sydney and over the years, the school slowly attracted a number of high performers from a number of schools located in western Sydney. At end of year 12, large percentage of top performers do not actually reside in the actual school catchment.

Writing must be like driving an elixir of healing, my headache actually mostly cleared up, maybe I should do this more often.

#1 to #11 Educational opportunity in Australia 2015