Since I recently did the blog entry on changes to the Epping Heights, Epping West and Roselea Public School catchment for 2016, I thought it would be fun to do a quick comparison between these three public schools.
First let’s look at distribution of the students over each quarters with each other and Australian average for the year 2014. I feel this is a good representation of how well the students in a school is doing without having to delve deeper into the stats. I also felt indication how well a school is doing is not only at top, also at the bottom as well.
| Bottom quater | Lower middle quater | Higher middle quater | Top quater |
| Epping Heights Public School | 1% | 6% | 23% | 71% |
| Epping West Public School | 1% | 4% | 19% | 75% |
| Roselea Public School | 7% | 18% | 30% | 46% |
| Australian Distribution | 25% | 25% | 25% | 25% |
Now let’s look like some miscellaneous stats about these three schools for the year 2014. ICSEA score for those that are not familiar with the term means “Index of Community Socio-Educational Advantage”. Attendance is also actually a good indication of school performance, in general better attendance of the school more likely it will perform better academically as well to the lower attendance counter part.
| ICSEA Score | Language background other than English | Attendance(2013) |
| Epping Heights Public School | 1158 | 57% | 96% |
| Epping West Public School | 1183 | 80% | 97% |
| Roselea Public School | 1098 | 54% | 97% |
Some more fun stuff, enrolment number from 2008 to 2014 for these three school. As you can see enrolment number for Epping Heights Public School increased by 22%, Epping West Public School increased by 33% and Roselea Public School actually decreased by 26% over the same time period. With these number it is not a surprise that in the most recent catchment changes Roselea got a significant increase to its catchment at expense of Epping west and Epping Heights public school.
| 2008 | 2009 | 2010 | 2011 | 2012 | 2013 | 2014 |
| Epping Heights Public School | 346 | 333 | 326 | 339 | 359 | 371 | 421 |
| Epping West Public School | 640 | 617 | 628 | 659 | 688 | 790 | 854 |
| Roselea Public School | 414 | 396 | 365 | 360 | 341 | 320 | 306 |
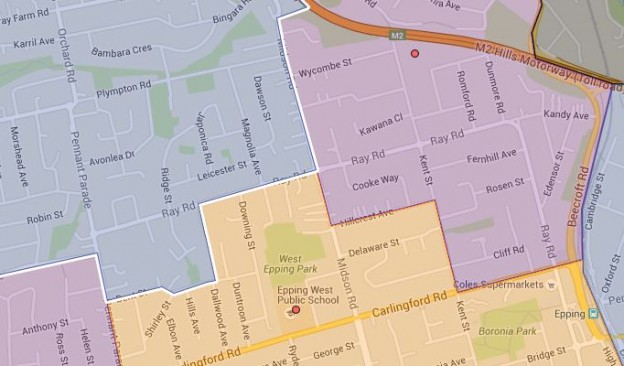
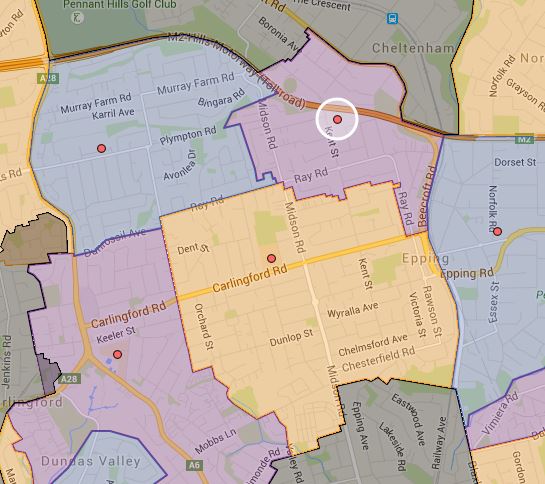
You can see the new 2016 catchment map for these three public school as following.
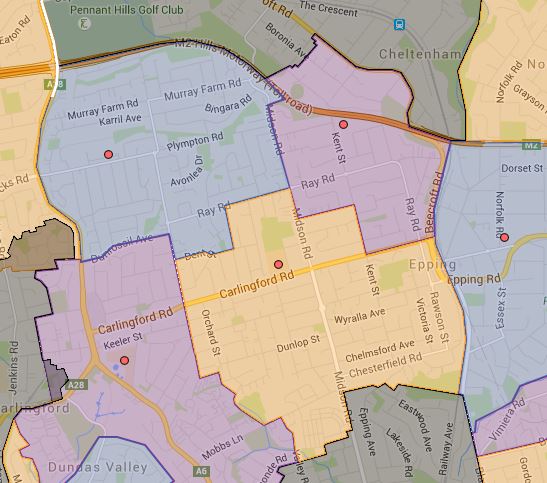
As usual contact the school in question or Department of Education for the final confirmation and you can also access the full NSW and Sydney Public School Catchment Map by following this link.
Share this post: